Barry Commoner, the great American environmentalist and communicator, summed up the universe of sustainable living and design in his four laws of ecology:
- Everything is connected to everything else.
- Everything must go somewhere.
- Nature knows best.
- There is no such thing as a free lunch.
LIFECYCLE ANALYSIS (LCA) helps us apply Commoner’s laws of ecology, giving us a framework to think about how things are connected. An effective response to climate change will require rich countries like Canada to reduce their greenhouse gas (GHG) emissions by 80 per cent or more. That will mean at least quadrupling the carbon-free share of our fuel and electricity supplies, and the efficiency with which we use them.
If ever there was a challenge that required careful, methodical thinking about how things are connected, this is it.
Lifecycle analysis can uncover the connections between GHG emissions and the myriad decisions and behaviours of individuals, households and companies that ultimately drive those emissions. What are the emission impacts of using high-efficiency appliances and lighting? Of telecommuting and teleshopping? Of waste reduction and recycling? Of green buildings? Lifecycle analysis can reframe the challenge of reducing GHG emissions, opening up more potential routes to a low-carbon energy system.
LCA is ideally suited to the problem of GHG reduction because global warming impacts don’t depend on where emissions take place, or on complicated pathway analyses. A tonne of greenhouse gas emissions has the same climate impact no matter where it’s produced in the lifecycle of a fossil fuel. The source could be a tar sands facility in Alberta, a vehicle tailpipe in Toronto’s rush hour, a gas plant in Saskatchewan or a furnace chimney in a Nova Scotia home. The level and pattern of fuel and electricity usage have emissions impacts that can be traced all the way back to the beginning of the lifecycle, and LCA helps us understand the connections that will lead to lower emissions, or even eliminate them.
Point of Emissions Allocation
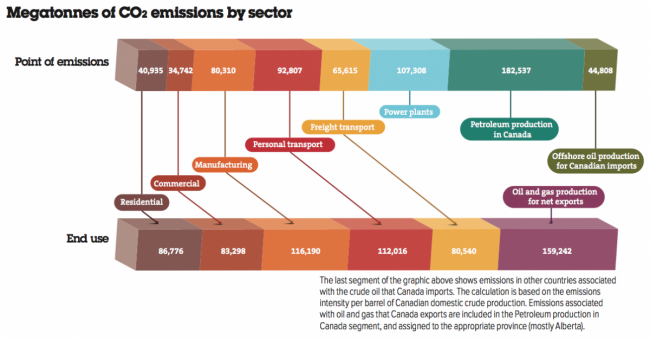
Conventionally, GHGs are assigned at the point of emissions, the physical location in the sector and province where the electricity is generated or the fuel is extracted. The resulting distribution pattern is a familiar one, and has become the most common framework for thinking about where Canada’s emissions come from.
By sector, the energy industry dominates, with fossil fuel and electric power production responsible for half of Canada’s GHG emissions. This scenario reinforces the need for emission reduction policies that put the onus on oil and gas producers and electric power generators. This certainly has some utility, but the biggest, most cost-effective opportunities to reduce GHG emissions can actually be found where energy is used, not where it is produced.
For example, using electricity more efficiently in homes and offices reduces the amount of power that must be generated in the first place. Likewise, limiting automobile travel and using fuel efficient cars and transit will cut tailpipe emissions, as well as reduce emissions along the supply chain from the oil field to the filling station.

Megatonnes of CO2 emissions by sector. Click the image for a larger version.
End Use Allocation
This alternative method of pinpointing fossil fuels and electric power emissions focuses on where the energy is actually used. For example, rather than power plants being held responsible for all of their GHG emissions, they are spread among the residential, commercial, manufacturing and transportation sectors in proportion to each one’s actual electricity use.
Compared to the point-of-emissions scenario, the end-use approach more than doubles the share of emissions that residential and commercial buildings contribute to Canada’s CO2 output. Emissions attributed to manufacturing, personal vehicles and freight transportation also increase, because the production, refining and transportation of the fuels and electricity that these activities consume are also considered. Altogether, domestic sectors account for 75 per cent of Canada’s total emissions, with the remaining 25 per cent allocated to end users in other countries.
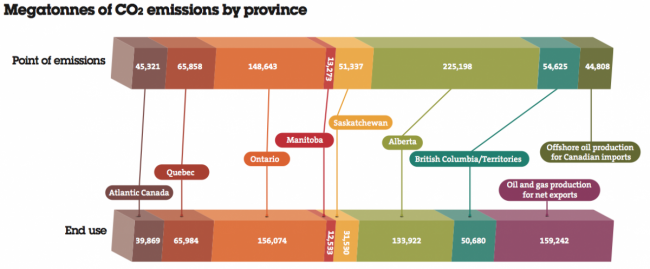
Using lifecycle analysis to see how emissions are redistributed by province brings a new perspective to Canada’s customary tensions over energy, which now includes the growing standoff over tar sands and pipeline development. Alberta towers over Ontario and the other provinces in the point-of-emissions allocation, since this calculation emphasizes oil and gas emissions while understating the role of consuming provinces and export markets in driving production. In the end-use analysis, Alberta is still a very emissions-intensive province, but its contributions are prorated to other provinces to better reflect the energy lifecycle.

Megatonnes of CO2 emissions by province. Click the image for a larger version.
Energy Services Allocation
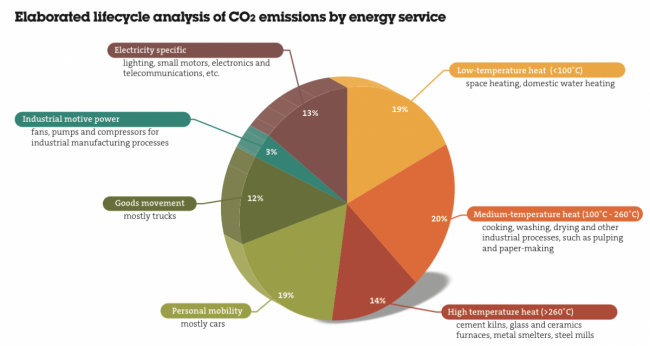
A more elaborate lifecycle analysis of GHG emissions based on energy end use indicates the underlying demand for energy services more clearly. More than half of Canada’s emissions can be traced back to a demand for heat, mostly in low- and medium-temperature applications like space heating, water heating and industrial processes that rely on steam to drive a turbine. About a third of emissions are associated with personal mobility (mostly cars) and goods movement (mostly trucks), and another 13 per cent is derived from electricity-specific end uses, such as lighting, electronics, small motors and appliances, information processing and communications.

Elaborated lifecycle analysis of CO2 emissions by energy service. Click the image for a larger version.
EACH OF THESE THREE FRAMES provides a different way of explaining where our emissions come from. They are all valid in their own way, and they all illustrate the same GHG emissions. But lifecycle analysis is the tool that helps us focus on the all-important connections between the emissions and the underlying drivers of fuel and electricity demand. We can also use LCA to:
- Quantify the considerable GHG reduction benefits of waste recycling;
- Compare net emissions from a range of alternative power generation technologies, such as wind turbines, photovoltaic cells or combined heat and power plants;
- Assess the role of embedded emissions in international trade;
- ?Compare the net GHG impacts of our various transportation fuel options, ranging from bitumen-based gasoline to ethanol or diesel fuels made from a variety of agricultural and forest-based biomass feed stocks.
The deep reductions in GHG emissions that will be necessary to respond to the threat of climate change will require pervasive changes in the way we use fuels and electricity. Lifecycle analysis is a powerful tool for identifying and quantifying the indirect connections between emissions and the various activities that produce them.
Sidebar: Plotting a Low-Carbon Future
The data assembled here comes from Trottier Energy Futures Project (TEFP), which is designed to engage with Canadians and gain a better understanding of how energy technologies, policy decisions and day-to-day practices could contribute to a low-carbon future. The results of these conversations will be integrated with the Canadian Energy System Simulator (CanESS), the quantitative model used for mapping an 80 per cent reduction in Canada’s energy-related GHG emissions (based on a 1990 baseline) by 2050. The TEFP has identified a series of 11 challenge areas that touch all sectors of the economy, and solutions in each area will eventually be fed back into the model.
Delve deeper into the benefits, complexities and specific applications of lifecycle analysis by watching some excellent video explanations we’ve found for you.
Ralph Torrie has been an A\J contributor since 1977, and is the managing director of Trottier Energy Futures Project.


